Indicators
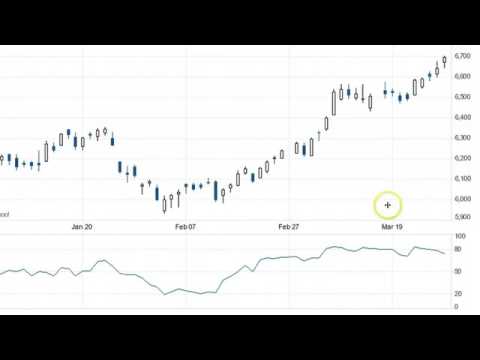
 FOREX RSI Indicator
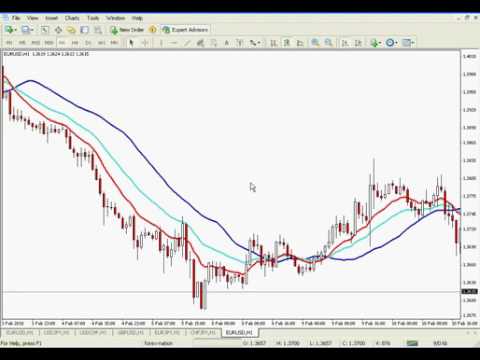 FOREX the Alligator Indicator
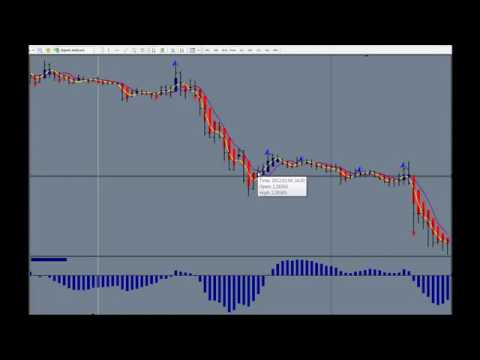 FOREX How to Determine if it is a Trend or Retracement
 FOREX Leverage Explained
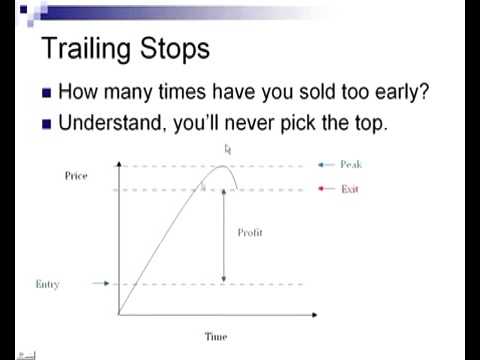 FOREX Using Trailing Stops to Maximize Profits
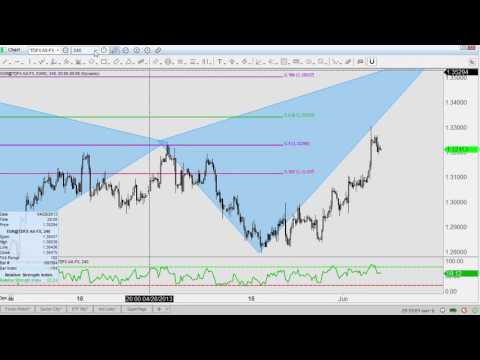 FOREX Pattern Trading
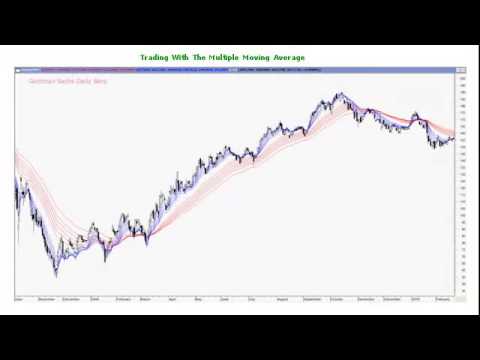 FOREX Trading with the Multiple Moving Average
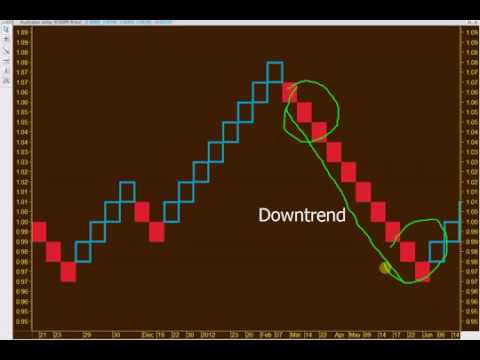 FOREX Renko Chart V1
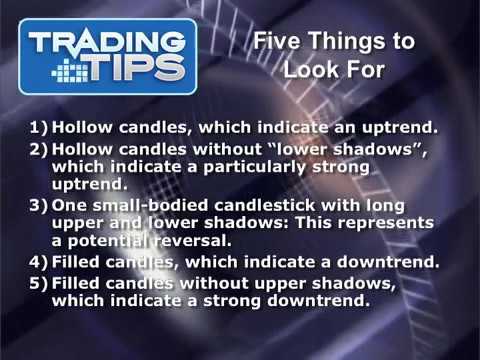 FOREX Heikin Ashi Candlesticks V2
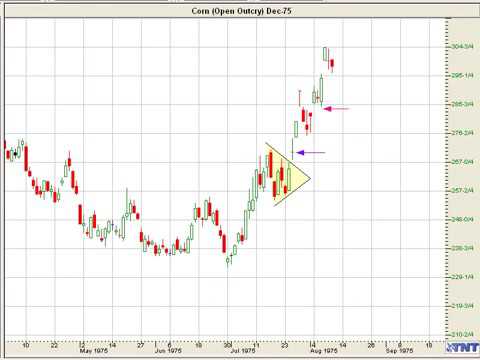 How to trail a stop loss
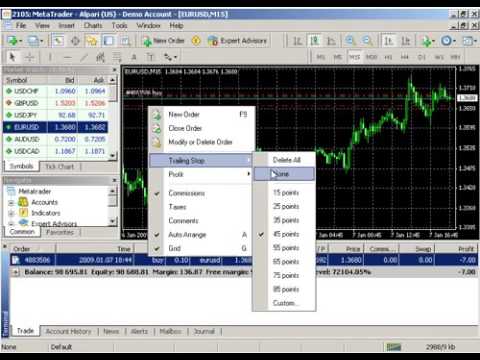 FOREX Setting Trailing Stop MT4 Platform
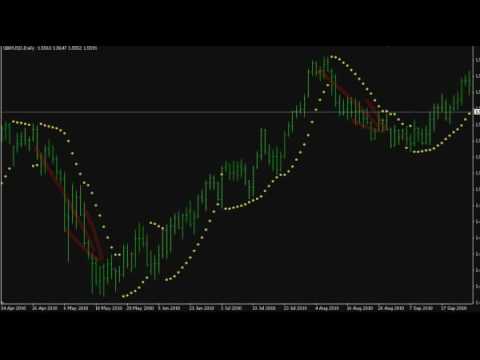 FOREX Parabolic SAR Indicator V1
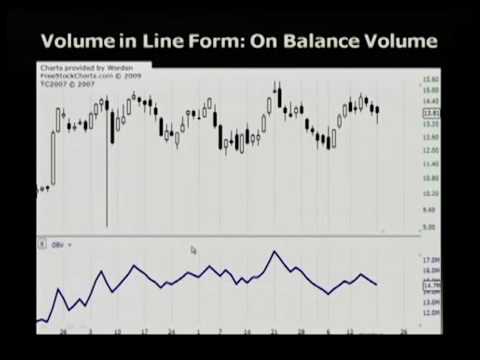 FOREX volume indicator
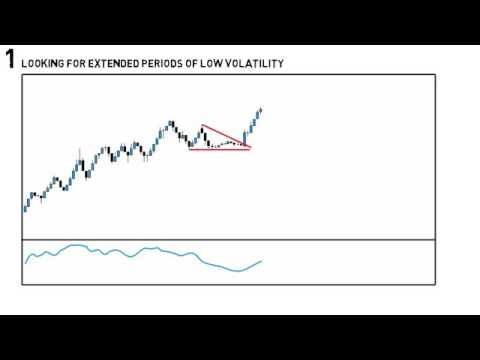 FOREX Average True Range ATR
 FOREX Ichimoku Kinko Hyo V2
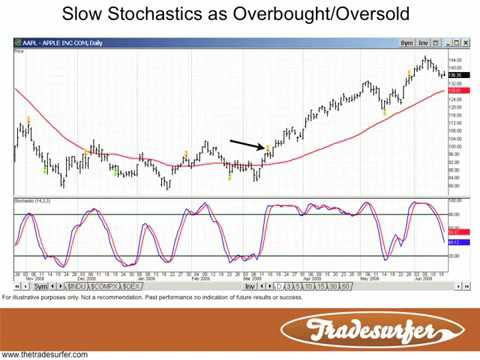 FOREX stochastic indicator
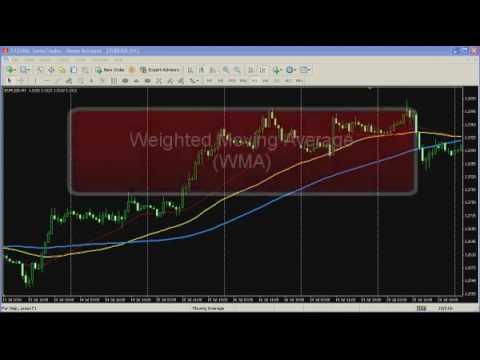 FOREX moving average
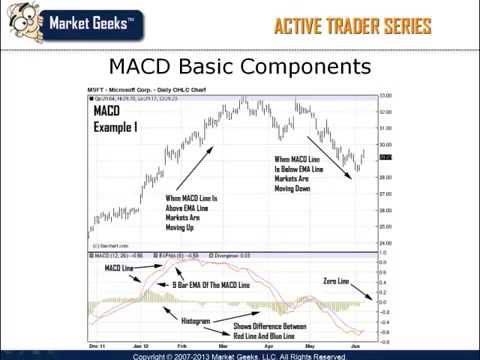 FOREX MACD indicator
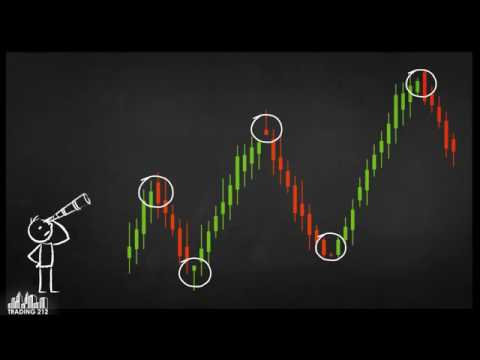 FOREX japanese candlestick charts
 Forex Fibonacci Trading Sequence
 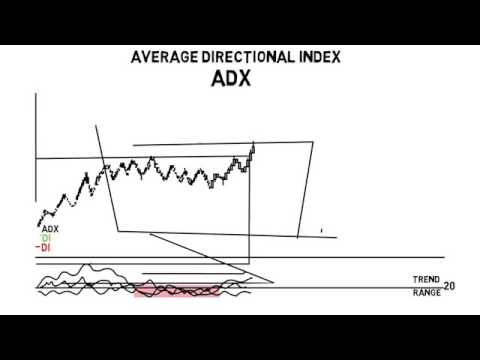 FOREX Average Directional Index ADX
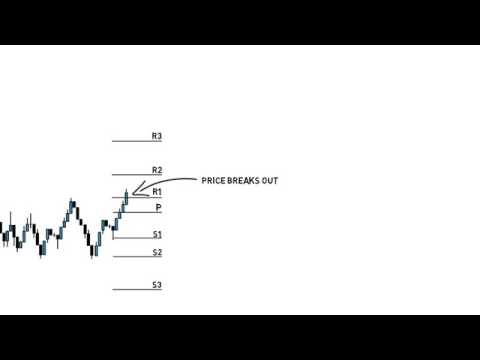 FOREX Pivot Points
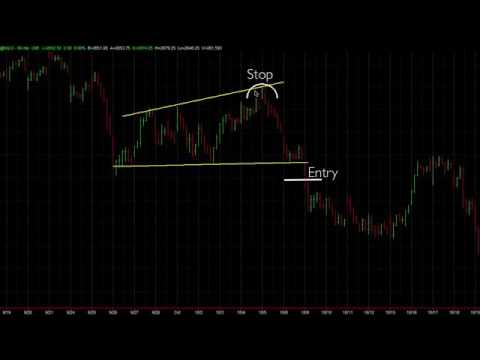 FOREX Using Trailing stops in Trading
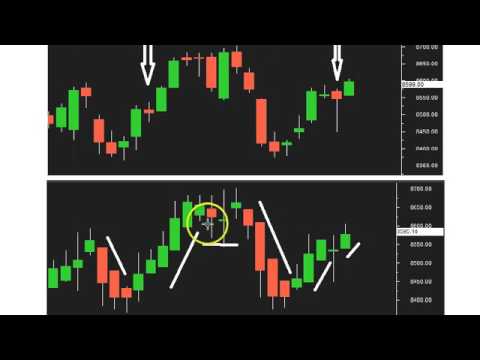 FOREX Heikin Ashi CandleSticks V1
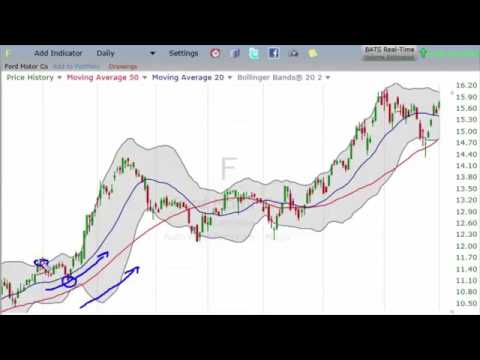 FOREX All About Bollinger Bands
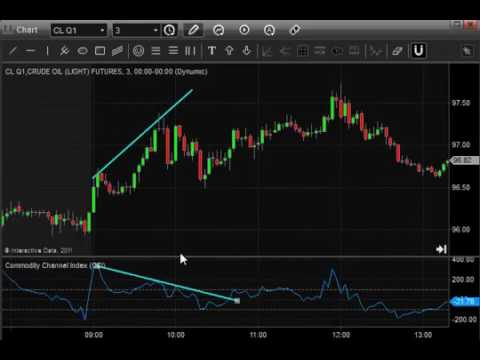 FOREX Indicator CCI Commodity Channel Index
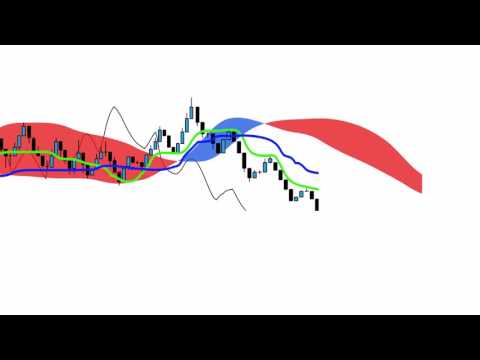 FOREX Ichimoku Kinko Hyo V1
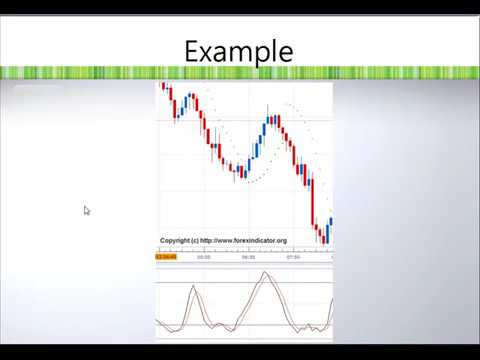 FOREX Best Forex Scalping Indicators
 FOREX what is forex
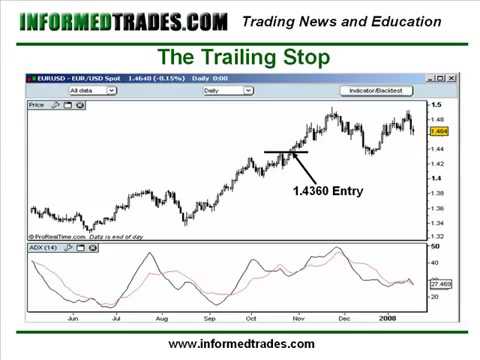 FOREX How to use trailing stops
Welcome to our Indicators video collection, a curated space where traders of all experience levels can learn how technical indicators work and how to apply them thoughtfully in real market conditions. Indicators are mathematical tools that transform raw price and volume data into visual signals, helping you interpret momentum, trend direction, volatility, and potential turning points. The videos gathered here focus on building a practical, honest understanding of these tools — not on promising shortcuts.
What This Collection Covers
The gallery below brings together tutorials and walkthroughs spanning the most widely used categories of Forex indicators. While the exact lineup updates over time, you can generally expect content that explores the following themes:
- Trend indicators — tools like moving averages and the ADX that help you gauge whether a currency pair is trending or ranging.
- Momentum oscillators — such as the RSI, Stochastic, and MACD, used to measure the speed of price movement and spot overbought or oversold conditions.
- Volatility measures — including Bollinger Bands and the Average True Range, which describe how much a market is moving.
- Volume and support tools — indicators that add context around participation and key price levels.
Each video aims to explain not just how to add an indicator to your chart, but why it behaves the way it does and where its limitations lie.
Who It’s For and How to Use It
This collection is designed to serve beginners who are meeting indicators for the first time, as well as intermediate traders looking to sharpen their interpretation or combine tools more effectively. If you are new, start with the fundamentals — understand what a single indicator measures before layering several together. More experienced viewers may prefer to jump to specific setups or comparisons.
To get the most out of these videos, we suggest a hands-on approach:
- Open a demo chart alongside the video so you can replicate each step in real time.
- Test one concept at a time rather than crowding your screen with too many indicators.
- Note how each tool reacts differently in trending versus ranging markets.
- Keep a trading journal to record what you observe and what confuses you.
A Balanced Perspective
It’s worth remembering that no indicator predicts the future. Indicators describe what price has already done and offer probabilities, not certainties. The most reliable results usually come from combining a small number of complementary tools with sound risk management and an understanding of market context. Use the videos below as a foundation for your own experimentation, and always confirm what you learn on a demo account before risking real capital. Browse the collection at your own pace and revisit topics as your skills develop.