Currency Correlation Strategy: How to Trade Correlated Forex Pairs
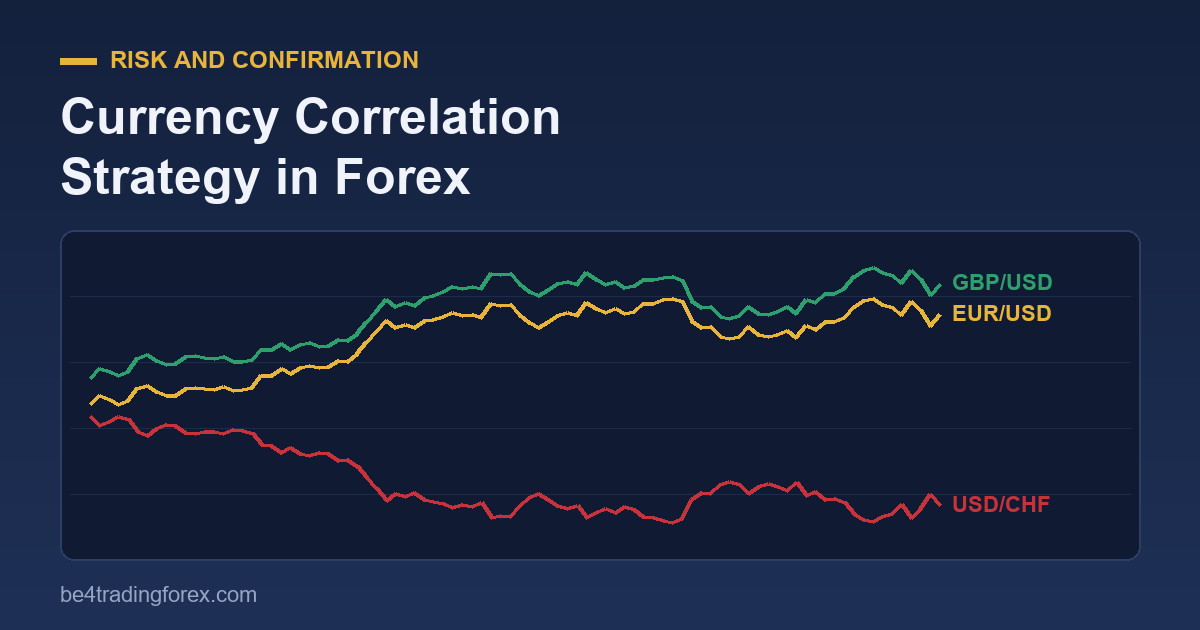
Currency pairs do not move independently. EUR/USD and GBP/USD often rise and fall together; EUR/USD and USD/CHF usually move in opposite directions. These relationships, called currency correlations, matter for every forex trader. Ignore them and you can end up with three trades that are really one big bet. Use them well and they help you control risk, confirm signals, and even find trades of their own. This guide explains how correlation works, which pairs are typically linked, how to measure it yourself, and four practical correlation strategies.
What Is Currency Correlation?
Correlation measures how closely two pairs move together. It is expressed as a correlation coefficient between −1 and +1:
| Coefficient | Meaning |
|---|---|
| +0.8 to +1.0 | Strong positive: the pairs usually move in the same direction |
| +0.5 to +0.8 | Moderate positive |
| −0.5 to +0.5 | Weak or no meaningful relationship |
| −0.5 to −0.8 | Moderate negative |
| −0.8 to −1.0 | Strong negative: the pairs usually move in opposite directions |
A coefficient of +1 would mean the two pairs move perfectly together, and −1 perfectly opposite. Real pairs never stay at either extreme for long.
Why Pairs Are Correlated
- A shared currency. EUR/USD and GBP/USD both have the US dollar as the quote currency. When the dollar weakens broadly, both tend to rise.
- Inverted quotes. EUR/USD has the dollar second; USD/CHF has it first. A stronger dollar pushes EUR/USD down and USD/CHF up, hence the negative correlation.
- Linked economies. Australia and New Zealand trade heavily with each other and with China, so AUD/USD and NZD/USD tend to move together.
- Commodities. Canada is a major oil exporter, so the Canadian dollar often strengthens when oil rises (USD/CAD falls). The Australian dollar has a similar link with gold and iron ore. Our article on currencies and crude oil explores the oil link in detail.
- Risk sentiment. In risk-off periods, safe havens such as the Japanese yen and Swiss franc tend to strengthen together, while higher-yielding currencies weaken.
Typical Correlations Between Major Pairs
These are typical long-run tendencies, not fixed values. Always check current readings before relying on them.
| Pair 1 | Pair 2 | Typical relationship |
|---|---|---|
| EUR/USD | GBP/USD | Positive, often strong |
| EUR/USD | USD/CHF | Negative, often very strong |
| AUD/USD | NZD/USD | Positive, often strong |
| EUR/USD | USD/JPY | Negative, but variable |
| USD/CAD | Crude oil | Negative (oil up, USD/CAD down) |
| AUD/USD | Gold | Positive, moderate |
How to Calculate Correlation Yourself
You do not need special software. A spreadsheet is enough:
- Export or copy the daily closing prices of both pairs for the same dates (for example the last 50 or 100 days). In MT4, File → Save As on a chart exports its data to CSV.
- Put each pair’s closes in its own column, with dates lined up.
- Use the formula
=CORREL(A2:A101, B2:B101)in Excel or Google Sheets. - Repeat with a shorter window (for example 20 days) to see whether the relationship is strengthening or breaking down.
Comparing a long and a short window is the key habit: correlations drift with interest rates, central bank policy and risk sentiment. Many brokers and charting sites also publish live correlation tables, and several free MT4 indicators plot correlation directly on the chart.
Strategy 1: Avoid Doubling Your Risk
This is the most important use of correlation. Suppose you buy EUR/USD and GBP/USD at the same time, risking 1% on each. With a strong positive correlation, you are effectively risking close to 2% on one idea: dollar weakness. If the dollar strengthens, both trades lose together.
Rules of thumb:
- Treat strongly correlated trades in the same direction as one position, and split your normal risk between them.
- Buying one pair and selling a strongly positively correlated pair (or buying two negatively correlated pairs) largely cancels out. Make sure that is what you intend.
- Check your open positions for hidden dollar, yen or euro exposure before adding a new trade.
This fits directly into the position-sizing rules in our risk management guide.
Strategy 2: Confirm Your Signals
If you get a breakout signal on EUR/USD, glance at GBP/USD and USD/CHF:
- Confirmation: GBP/USD is breaking higher too, and USD/CHF is breaking lower. The move is broad dollar weakness, which usually has more follow-through.
- Warning: EUR/USD breaks out alone while the correlated pairs do nothing. The move may be euro-specific news, or a false breakout.
The same logic helps with indicator signals. A MACD crossover that appears on several correlated pairs at once is stronger than one appearing on a single chart.
Strategy 3: Trade the Stronger Pair
When several correlated pairs show the same setup, pick the one with the cleanest trend, the strongest momentum or the best risk-to-reward. For example, if the dollar is falling, compare EUR/USD, GBP/USD and AUD/USD and choose the pair where the opposing currency is also fundamentally strong. You get the same theme with a better chart.
Strategy 4: Correlation Divergence (Pairs Trading)
When two normally correlated pairs temporarily move apart, some traders bet on them coming back together:
- Identify a historically strong correlation, for example AUD/USD and NZD/USD.
- Watch for an unusual gap: one pair rallies strongly while the other lags.
- Sell the outperformer and buy the laggard, sizing both so each leg carries similar risk.
- Close both when the gap narrows back to normal.
Be careful: divergences sometimes happen for good reasons, such as a surprise rate decision in one country, and the relationship may not return. Use a stop on the combined position and check the news before trading a divergence.
Common Correlation Mistakes
- Assuming correlations are fixed. They change, sometimes quickly. Re-check them regularly.
- Using too short a window. A 10-day correlation is noisy. Use 50 to 100 days for the baseline, and a shorter window to spot change.
- Confusing correlation with cause. Two pairs can move together by coincidence for a while. Prefer relationships with a clear economic reason.
- Hidden overexposure. Five “different” trades can all be short the US dollar.
Watch: Correlation Strategies
Our video library covers this topic too: forex correlation strategy and correlation strategy.
Frequently Asked Questions
Which currency pairs are most correlated?
EUR/USD and USD/CHF typically have a strong negative correlation, while EUR/USD and GBP/USD, and AUD/USD and NZD/USD, are typically strongly positive. Always check current values.
How often do correlations change?
They drift continuously and can shift sharply around central bank decisions or market shocks. Reviewing them weekly is a good habit.
What is a good correlation coefficient?
Above +0.8 or below −0.8 is considered strong. Between −0.5 and +0.5, the relationship is too weak to rely on.
Can correlation be used for hedging?
Yes. Opposite positions in positively correlated pairs (or the same direction in negatively correlated pairs) offset each other. Remember that spreads and swap costs still apply to both legs.
Trading forex on margin carries a high level of risk and may not be suitable for all investors. This guide is educational and is not financial advice.
Keep learning