ATR Indicator: How to Use Average True Range for Stops and Position Size
The Average True Range (ATR) does not tell you which way the market will go. It tells you something more useful for survival: how far the market typically moves. That single number lets you place stop losses outside normal noise, size positions so every trade risks the same amount of money, and set realistic profit targets. This guide explains how ATR works, how to read it in MetaTrader, and how to turn it into concrete stop-loss and position-sizing rules, with worked numbers you can copy.
What Is the ATR Indicator?
ATR was developed by J. Welles Wilder Jr. and published in 1978 in New Concepts in Technical Trading Systems, the same book that introduced the RSI and Parabolic SAR. It measures volatility: the average size of each candle’s full range, including gaps.
- Rising ATR: candles are getting bigger, so the market is more volatile.
- Falling ATR: candles are shrinking, so the market is quieter, often before a breakout.
ATR is non-directional. A sharp sell-off and a sharp rally both raise it. Use it to decide how much room and size to give a trade, and use other tools to decide direction.
How ATR Is Calculated
First, Wilder defined the True Range (TR) of each candle as the largest of:
- Current high minus current low
- The absolute value of current high minus previous close
- The absolute value of current low minus previous close
Including the previous close captures gaps, such as the Sunday open in forex. The ATR is then a smoothed average of the True Range, by default over 14 periods. Each new ATR value is 13/14 of the previous ATR plus 1/14 of the latest TR, so it reacts gradually rather than jumping on one big candle.
How to Read ATR in MT4
Add it via Insert → Indicators → Oscillators → Average True Range. It appears in a separate window as a single line, and its value is shown in price units, not pips:
| Pair | ATR reading | Meaning |
|---|---|---|
| EUR/USD (daily) | 0.00700 | 70 pips average daily range |
| GBP/USD (1-hour) | 0.00180 | 18 pips average hourly range |
| USD/JPY (daily) | 0.950 | 95 pips (yen pairs: 0.01 = 1 pip) |
| Gold XAU/USD (daily) | 32.50 | About $32.50 average daily range |
For most pairs, multiply the reading by 10,000 to get pips. For yen pairs, multiply by 100. ATR always reflects the timeframe of the chart it is on: a daily ATR and a 15-minute ATR on the same pair are very different numbers.
Use 1: Setting a Stop Loss with ATR
A stop that is too tight gets hit by random noise; a stop that is too wide risks more than the setup justifies. ATR stops solve this by scaling with current volatility.
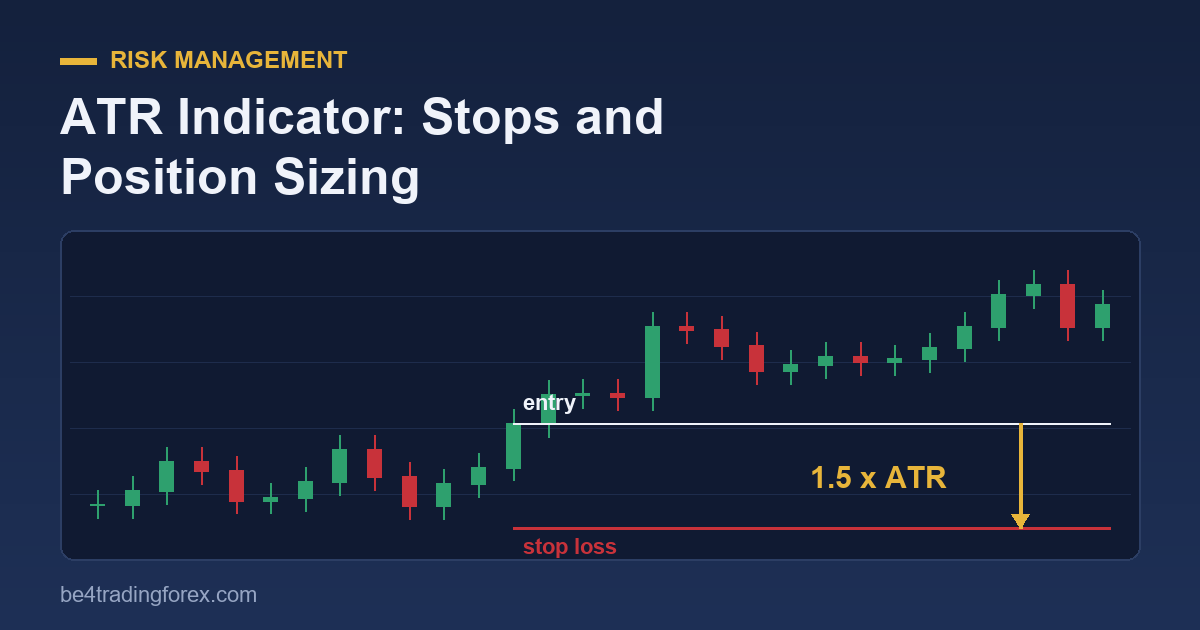
Rule: place the stop a multiple of ATR away from your entry, or beyond a nearby swing point plus a buffer.
- 1 × ATR: tight. Suits scalping or very precise entries.
- 1.5 to 2 × ATR: the most common range for swing and intraday trades.
- 3 × ATR: wide. Suits long-term trend following.
Example: you buy EUR/USD at 1.08500 on the daily chart. ATR(14) reads 0.00700 (70 pips). A 1.5×ATR stop is 105 pips below entry, at 1.07450.
The advantage is consistency. When the market gets wild, your stop automatically widens. When it calms down, it tightens, so you are not using last month’s numbers in this month’s market.
Use 2: Position Sizing with ATR
This is where ATR really pays off. If stops vary with volatility, the lot size must vary too, so that every trade risks the same percentage of your account. Here is the formula:
Lot size = (Account balance × Risk %) ÷ (Stop distance in pips × Pip value per standard lot)
Worked example:
- Account balance: $10,000
- Risk per trade: 1% = $100
- Stop distance: 1.5 × ATR = 105 pips (from the example above)
- Pip value on EUR/USD: $10 per pip per standard lot
Lot size = $100 ÷ (105 × $10) = $100 ÷ $1,050 = 0.095 lots. Round down to 0.09 lots, so the risk stays at or below 1%.
If ATR doubles to 140 pips next month, the same formula gives you about half the position size. Your dollar risk stays the same. This is the volatility-adjusted sizing professional traders use, and it is the practical core of our risk management guide. It also shows why high leverage is dangerous when you size by feel instead of by numbers.
Use 3: Trailing Stops with ATR (the Chandelier Exit)
ATR is ideal for trailing stops because it keeps the stop outside normal pullbacks. The best-known version is the Chandelier Exit, popularised by Chuck LeBeau:
- Long trades: stop = highest high of the last 22 candles − 3 × ATR(22).
- Short trades: stop = lowest low of the last 22 candles + 3 × ATR(22).
The stop “hangs” from the high like a chandelier from a ceiling and only ratchets in your favour. A simpler variant is to trail by 2×ATR of your timeframe. Our guide on how to set a trailing stop in MT4 shows how to apply that distance in the platform.
Use 4: Realistic Profit Targets and Daily Range
Daily ATR tells you how far a pair typically travels in a day. That helps in two ways:
- Target sanity check: aiming for 150 pips intraday on a pair with a 70-pip daily ATR is unrealistic most days.
- Late-entry filter: if a pair has already moved close to 100% of its daily ATR by midday, the easy part of the move is often done. A fresh breakout entry in the same direction has less room left.
Use 5: Spotting Volatility Squeezes
When ATR falls to its lowest level in weeks, the market is coiling. Low volatility tends to be followed by high volatility, so a multi-week ATR low often comes before a strong breakout. Combine this with Bollinger Bands narrowing (the “squeeze”) for confirmation, then trade the break of the range.
ATR Settings: 14 or Something Else?
- 14 (default): good for most uses, including stops and sizing.
- 20 to 22: slightly smoother; standard for the Chandelier Exit.
- 5 to 7: reacts fast to sudden volatility changes. Useful around news, but noisy.
Stick to one setting per strategy, so your stops and lot sizes are comparable from trade to trade.
Common ATR Mistakes
- Reading ATR as a direction signal. Rising ATR does not mean “buy”. It means bigger candles.
- Mixing timeframes. Do not use a daily ATR for a 5-minute scalp’s stop.
- Widening stops without shrinking size. An ATR stop without ATR-based sizing increases your risk exactly when markets are most dangerous.
- Forgetting the spread. On tight stops, add the typical spread to your ATR distance.
Watch: ATR Explained
See the indicator on a live chart in our video Forex Average True Range (ATR).
Frequently Asked Questions
What is a good ATR multiplier for stop losses?
1.5 to 2 times ATR suits most swing and intraday trades. Use around 1 for scalping and about 3 for long-term trend following.
How do I convert ATR to pips?
For most pairs, multiply the ATR value by 10,000. For yen pairs, multiply by 100. Example: 0.00700 = 70 pips; 0.950 on USD/JPY = 95 pips.
Does ATR work for gold and indices?
Yes. The reading is simply in that instrument’s price units, for example dollars per ounce for gold.
Is a high ATR good or bad?
Neither. High ATR means bigger moves and bigger risk per lot. Trade smaller when ATR is high, and expect slower markets when it is low.
Trading forex on margin carries a high level of risk and may not be suitable for all investors. This guide is educational and is not financial advice.
Keep learning