Forex Pivot Points: How to Calculate and Trade Them
Pivot points are one of the oldest tools in trading. They began on exchange trading floors, where traders needed quick support and resistance levels for the day ahead, and they are still watched by bank dealers and retail traders alike. Because so many people watch the same levels, price often reacts at them. This guide shows how to calculate forex pivot points by hand, explains the four main types (standard, Fibonacci, Woodie and Camarilla), and gives you three practical ways to trade them, with a worked example.
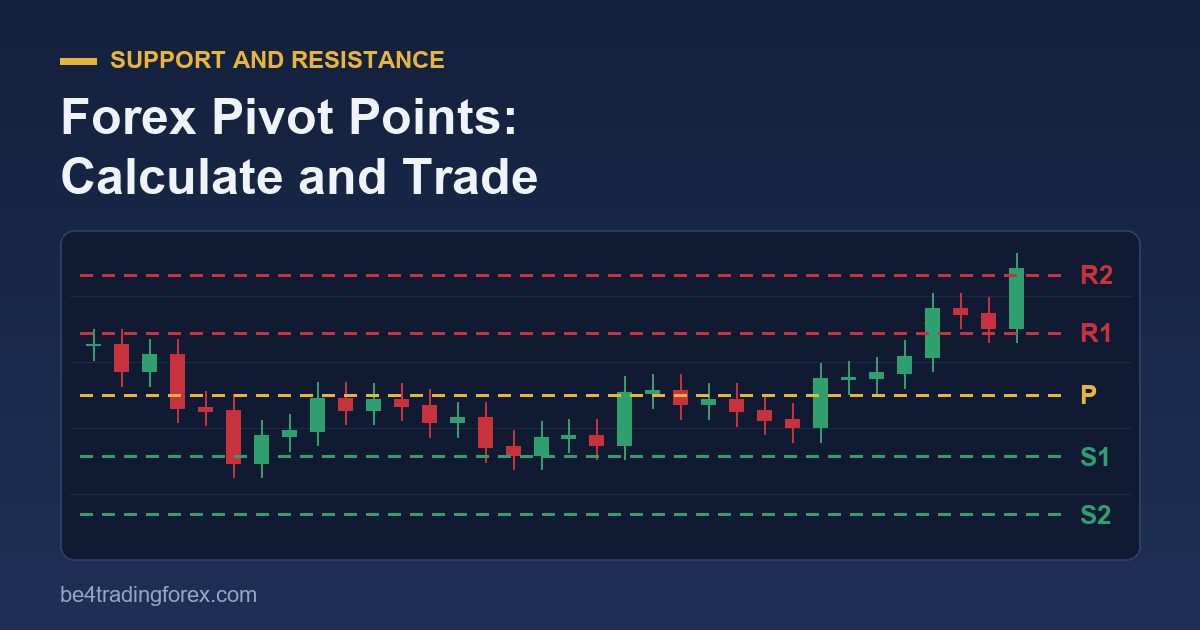
What Are Pivot Points?
A pivot point is a level calculated from the previous period’s high, low and close. From that central pivot (P), the formula projects support levels (S1, S2, S3) below and resistance levels (R1, R2, R3) above. Day traders use the previous day’s data to get today’s levels; swing traders can use the previous week or month.
The idea is simple:
- Price above P: the session has a bullish bias; R1 and R2 are likely targets.
- Price below P: the bias is bearish; S1 and S2 are likely targets.
- S and R levels: places where price often pauses, reverses or accelerates.
Unlike indicators that redraw with every candle, pivot levels are fixed for the whole session once it opens. That makes them objective: you know your levels before the market moves.
How to Calculate Standard (Floor) Pivot Points
Using the previous day’s High (H), Low (L) and Close (C):
| Level | Formula |
|---|---|
| Pivot (P) | (H + L + C) ÷ 3 |
| R1 | (2 × P) − L |
| S1 | (2 × P) − H |
| R2 | P + (H − L) |
| S2 | P − (H − L) |
| R3 | H + 2 × (P − L) |
| S3 | L − 2 × (H − P) |
Worked example (EUR/USD)
Yesterday’s EUR/USD: High 1.0950, Low 1.0850, Close 1.0920.
- P = (1.0950 + 1.0850 + 1.0920) ÷ 3 = 1.0907
- R1 = 2 × 1.0907 − 1.0850 = 1.0963
- S1 = 2 × 1.0907 − 1.0950 = 1.0863
- R2 = 1.0907 + 0.0100 = 1.1007
- S2 = 1.0907 − 0.0100 = 1.0807
- R3 = 1.0950 + 2 × (1.0907 − 1.0850) = 1.1063
- S3 = 1.0850 − 2 × (1.0950 − 1.0907) = 1.0763
(Calculated with the unrounded pivot, 1.090667, then rounded to four decimals.) If EUR/USD opens today at 1.0915, it is just above the pivot, so the early bias is mildly bullish, with R1 at 1.0963 as the first upside target.
Which Daily Close Should You Use?
Forex trades around the clock, so the “previous day” depends on where the day ends. The market convention is the New York close at 5 pm New York time. If your broker’s server uses a different day boundary, its daily candles, and therefore your pivots, will differ from what other traders see. Many brokers run their servers on GMT+2/GMT+3 precisely so daily candles close at 5 pm New York. If yours does not, a pivot indicator that lets you set a custom session start will give you the levels the wider market is watching. Watch out for small Sunday candles too, which can distort Monday’s pivots on some feeds.
The Four Main Types of Pivot Points
1. Standard (floor) pivots
The formulas above. They are the most widely watched, which is exactly why they work: the more traders act on a level, the more likely price reacts there.
2. Fibonacci pivots
These use the same central pivot, but space S and R levels with Fibonacci ratios of the previous day’s range:
- R1 = P + 0.382 × (H − L); S1 = P − 0.382 × (H − L)
- R2 = P + 0.618 × (H − L); S2 = P − 0.618 × (H − L)
- R3 = P + 1.000 × (H − L); S3 = P − 1.000 × (H − L)
They are popular with traders who already use Fibonacci levels for entries.
3. Woodie pivots
Woodie pivots give extra weight to the close: P = (H + L + 2 × C) ÷ 4. The S and R levels then use the standard formulas with this pivot. The result reacts more to where the market actually finished, which some intraday traders prefer.
4. Camarilla pivots
Camarilla levels are built around the previous close and sit much closer to price. The most-watched levels are:
- R3 = C + (H − L) × 1.1 ÷ 4; S3 = C − (H − L) × 1.1 ÷ 4
- R4 = C + (H − L) × 1.1 ÷ 2; S4 = C − (H − L) × 1.1 ÷ 2
The classic Camarilla approach is to fade moves at R3/S3 (expecting a return toward the range) and to trade breakouts through R4/S4. Because the levels are tight, Camarilla suits range-bound intraday sessions.
Strategy 1: Trading the Bounce
Best in quiet, range-bound sessions:
- Wait for price to reach S1 (for a long) or R1 (for a short).
- Look for confirmation: a rejection candle such as a pin bar or engulfing pattern (see our candlestick guide), or an oscillator like the RSI turning from an extreme.
- Enter in the direction of the rejection. Place the stop a few pips beyond the level, or beyond S2/R2 if the level is very close.
- Target the central pivot P first, then the opposite level.
Strategy 2: Trading the Breakout
Best on news days and trending sessions:
- Identify a level price is pressing against, such as R1.
- Wait for a candle close beyond it on your trading timeframe, not just a wick through it.
- Enter on the close, or on a retest of the broken level from the other side (old resistance becoming support).
- Target the next level (R2). Place the stop back inside the level you broke.
Rising volatility helps breakouts. If daily ATR is expanding, breaks of R1/S1 are more likely to follow through.
Strategy 3: The Pivot as a Bias Filter
The simplest use of all: only look for longs while price is above P, and only shorts while it is below. Combined with your usual entry method, whether moving average crosses, MACD signals or price action, this one filter removes many counter-trend trades.
How to Add Pivot Points in MT4
MT4 has no built-in pivot indicator, but pivot indicators are among the most common free custom indicators. To install one:
- Download a pivot point indicator (.ex4 or .mq4 file). Our free MetaTrader indicators collection is a good place to start.
- In MT4, go to File → Open Data Folder → MQL4 → Indicators and paste the file there.
- Restart MT4 or right-click Indicators in the Navigator and choose Refresh.
- Drag the indicator onto your chart, and check its settings for pivot type (standard, Fibonacci, Camarilla) and session start time.
Prefer to see it done? Watch our video on forex pivot points.
Pivot Point Tips and Common Mistakes
- Treat levels as zones, not exact prices. Price often overshoots a pivot by a few pips before reacting.
- Look for confluence. A pivot that lines up with a round number, a previous swing high or a moving average is far stronger than one on its own.
- Do not trade every level. R3 and S3 are rarely reached on normal days. When they are, it usually means a strong trend you should not fade.
- Use weekly pivots for swing trades. Daily pivots matter most to intraday traders; weekly and monthly pivots suit H4 and daily charts.
- Check your session time. Pivots built from the wrong daily close are levels no one else is watching.
Frequently Asked Questions
Which pivot point type is best for forex?
Standard pivots are the most widely watched, which makes them the best default. Camarilla suits tight intraday ranges; Fibonacci suits traders who already use Fibonacci tools.
What timeframe works best with daily pivot points?
Daily pivots work best on M5 to H1 charts for intraday trading. For H4 and daily charts, use weekly or monthly pivots.
Do pivot points work for gold and indices?
Yes. The calculation is the same for any market with a defined high, low and close.
Are pivot points a complete strategy?
No. They give you levels and bias. Combine them with confirmation, such as candlestick patterns, an oscillator or volume, and with strict risk management.
Trading forex on margin carries a high level of risk and may not be suitable for all investors. This guide is educational and is not financial advice.
Keep learning