CCI Indicator in Forex: Settings, Signals and 4 Strategies
The Commodity Channel Index (CCI) is one of the most flexible oscillators in MetaTrader. Despite its name, it works on any market, including forex. Traders use it to spot new trends, to time pullback entries inside an existing trend, and to find exhaustion through divergence. The catch is that CCI behaves differently from bounded oscillators like the RSI, so traders who treat +100 and −100 as simple “overbought” and “oversold” lines often get the signals backwards. This guide explains how CCI is calculated, which settings to use, and four ways to trade it, with clear rules for each.
What Is the CCI Indicator?
CCI was introduced by Donald Lambert in 1980 to identify cyclical turns in commodity prices. It measures how far the current price is from its recent average, scaled by how much price normally deviates from that average. In plain terms:
- CCI near 0: price is close to its average. No strong push either way.
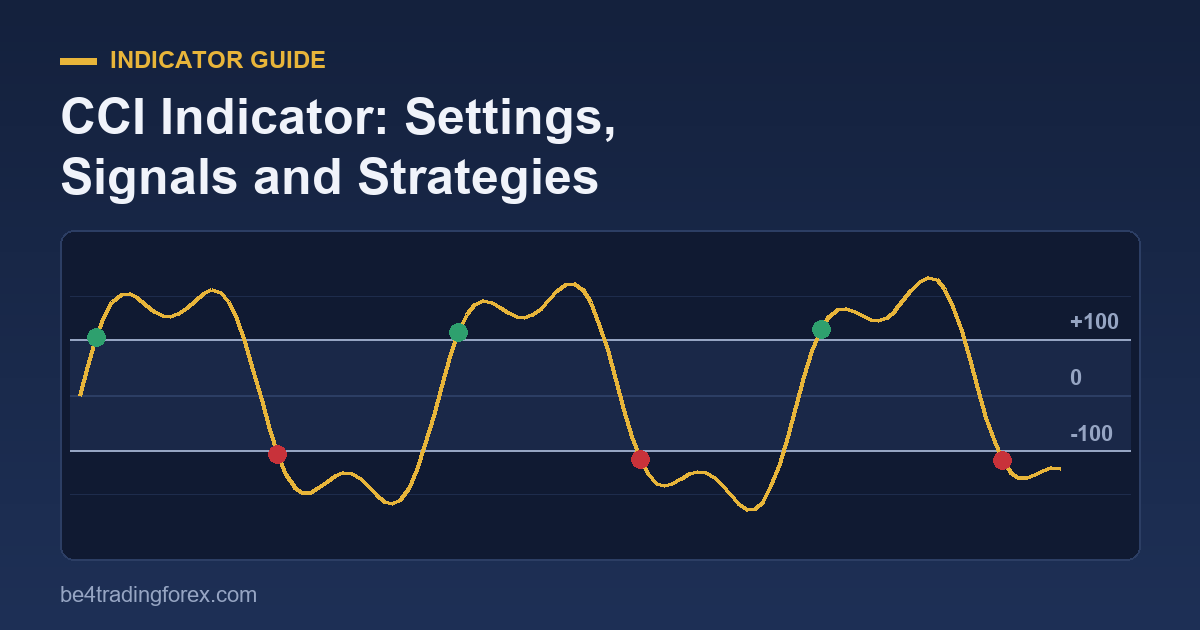
- CCI above +100: price is unusually far above its average, which signals strong upward momentum.
- CCI below −100: price is unusually far below its average, which signals strong downward momentum.
Unlike the RSI, which is locked between 0 and 100, CCI is unbounded. It can reach +300 or −400 in a powerful move. That is the key to reading it correctly: an extreme reading often means strength, not an imminent reversal.
How CCI Is Calculated
You never need to calculate it by hand, but knowing the formula explains its behaviour:
- Typical Price (TP) = (High + Low + Close) ÷ 3 for each candle.
- Moving average of TP over n periods (simple average).
- Mean deviation: the average distance between each TP and that moving average over the same n periods.
- CCI = (TP − moving average of TP) ÷ (0.015 × mean deviation).
Lambert chose the 0.015 constant so that roughly 70 to 80 percent of readings fall between −100 and +100. A move outside that band is, by design, statistically unusual. That is why the ±100 lines matter so much.
Best CCI Settings for Forex
In MT4, add it via Insert → Indicators → Oscillators → Commodity Channel Index. The default is a period of 14 applied to the Typical Price. Common choices:
| Period | Character | Typical use |
|---|---|---|
| 14 (MT4 default) | Balanced | General swing and intraday trading |
| 20 | Smoother, fewer signals | Lambert’s original suggestion; trend identification on H4 and daily |
| 6 to 9 | Fast, noisy | Scalping and short-term timing, often alongside a slower CCI |
| 50 | Very slow | Trend filter: only trade in the direction of CCI(50)’s side of zero |
Add level lines at +100, −100 and 0 (right-click the indicator, then Properties → Levels). Some traders also add ±200 to mark true extremes.
Strategy 1: The ±100 Trend Breakout (Lambert’s Original)
Lambert’s own use was not “sell when overbought”. It was: a move above +100 signals the start of a strong uptrend; a move below −100 signals a strong downtrend.
- Buy when CCI crosses above +100. Exit when it falls back below +100 (aggressive) or below 0 (more patient).
- Sell when CCI crosses below −100. Exit when it rises back above −100 or above 0.
- Filter: only take the signal in the direction of the higher-timeframe trend, for example the slope of the 50 EMA on the next timeframe up.
This approach catches momentum bursts and works best on pairs that trend cleanly, such as GBP/JPY or AUD/JPY during active sessions.
Strategy 2: Pullback Entries in an Existing Trend
In a confirmed uptrend, CCI dipping below −100 is usually a pullback, not a reversal. That makes it a lower-risk place to join the trend.
- Define the trend: price above the 100 EMA, and CCI(50) above zero.
- Wait for CCI(14) to drop below −100.
- Enter long when CCI(14) crosses back above −100.
- Place the stop below the pullback’s swing low. Target the previous high, or trail the stop (see our guide on trailing stops in MT4).
Reverse every rule for downtrends: CCI above +100 during a downtrend is a selling opportunity once it crosses back below +100.
Strategy 3: Zero-Line Cross
The zero line is where price meets its own average. A cross above zero shifts the bias bullish; a cross below shifts it bearish. On its own it produces many whipsaws in ranges, so use it as a bias filter or exit signal rather than a stand-alone entry: for example, hold longs while CCI stays above zero and exit on the first close below it.
Strategy 4: CCI Divergence
Divergence is CCI’s most reliable reversal warning:
- Bearish divergence: price makes a higher high, but CCI makes a lower high, ideally from above +100. Momentum is fading even as price pushes up.
- Bullish divergence: price makes a lower low while CCI makes a higher low, ideally from below −100.
Divergence is a warning, not a trigger. Wait for confirmation, such as a break of a trendline, a reversal candlestick pattern (see our Japanese candlesticks guide), or CCI crossing back through ±100, before entering.
A Note on Woodies CCI
“Woodies CCI” is a popular trading method built entirely around CCI. It typically uses a 14-period CCI with a fast 6-period “turbo” CCI, and trades patterns such as the zero-line reject and trendline breaks drawn directly on the CCI line. If you find CCI suits you, it is worth studying. Start with the four core strategies above first.
CCI vs RSI vs Stochastic
| CCI | RSI | Stochastic | |
|---|---|---|---|
| Range | Unbounded | 0 to 100 | 0 to 100 |
| Measures | Distance from average, scaled by volatility | Ratio of up moves to down moves | Close relative to recent high-low range |
| Best at | Trend emergence, pullbacks, divergence | Overbought/oversold, divergence | Timing in ranges |
| Main pitfall | Selling strength just because CCI is “high” | Staying overbought in strong trends | Many false signals in trends |
Because they overlap, avoid stacking all three. Pick one oscillator and pair it with a trend tool such as moving averages or a volatility tool like Bollinger Bands.
Common CCI Mistakes
- Fading every +100 reading. In a trend, CCI above +100 is strength. Shorting it fights momentum.
- Ignoring the trend. Signals against the higher-timeframe trend fail far more often.
- Using a fast setting without a filter. CCI(6) on a 1-minute chart produces constant noise. Pair it with a slower CCI or moving average.
- Treating divergence as an entry. Divergence can persist for many candles. Wait for price to confirm.
Systems on Our Site That Use CCI
If you want to see CCI inside complete rule sets, these strategies build on it:
And for a visual walkthrough, watch our videos: CCI (Commodity Channel Index) explained and Commodity Channel Index or CCI.
Frequently Asked Questions
What is the best CCI setting for forex?
14 is a sound default for most timeframes. Use 20 for smoother trend signals on H4 and daily charts, and a fast 6 to 9 only alongside a slower filter.
Is CCI a leading or lagging indicator?
It is based on a moving average, so it lags slightly, but divergence and ±100 crosses often appear before the move is obvious on price alone.
Does CCI work on all timeframes?
Yes. The logic is the same from M5 to weekly. Higher timeframes give fewer but more reliable signals.
Is CCI good for scalping?
It can be, with a short period (6 to 9) and a trend filter. Expect more false signals than on higher timeframes, and keep risk per trade small.
Trading forex on margin carries a high level of risk and may not be suitable for all investors. This guide is educational and is not financial advice.
Keep learning