Forex Market Sentiment: How to Read It (COT, Positioning and Risk Mood)
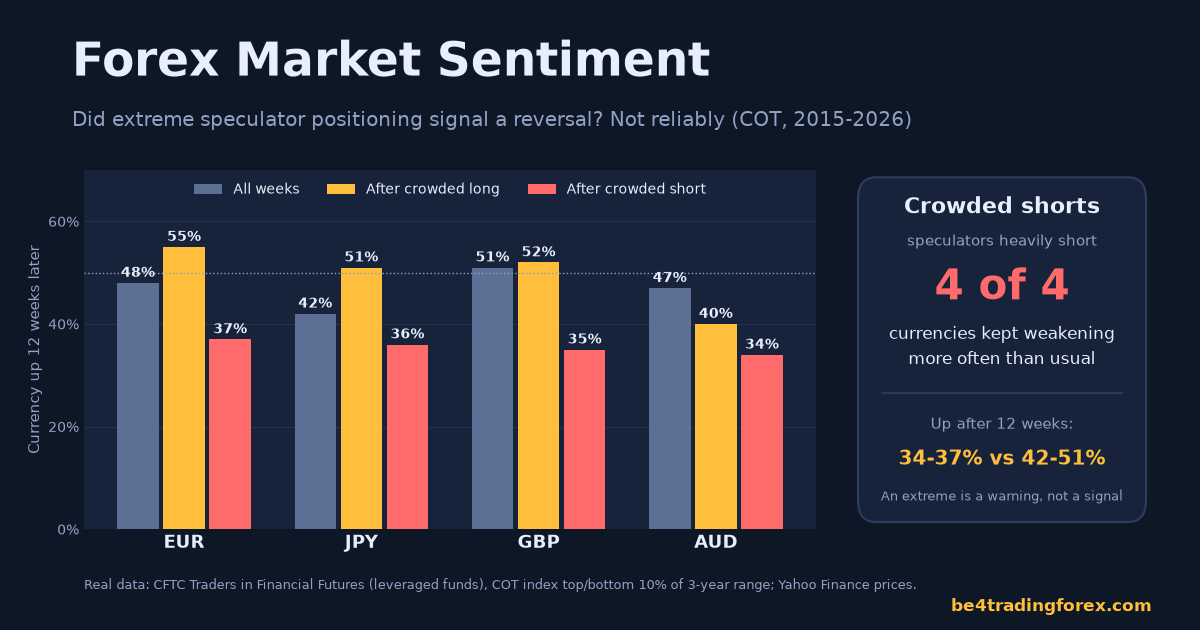
Market sentiment is the overall attitude of traders toward a currency or toward risk in general: bullish or bearish, confident or afraid. Sentiment analysis reads that mood from three kinds of data: how traders are positioned (the CFTC’s COT report, broker client data), the market’s risk mood (stocks, volatility, AUD/JPY) and the tone of news and central banks. It works best as a filter, not a trigger. When we tested the popular idea that extreme positioning signals a reversal, using ten years of COT data on four currencies, it didn’t hold up: when speculators were heavily short, the currency kept weakening more often than usual in all four cases.
What Is Market Sentiment?
Prices move when buyers and sellers change their minds. Market sentiment is the sum of those opinions: whether most traders expect a currency to rise or fall, and how willing they are to take risk at all. It is not the same as the fundamentals. A currency can have strong economic data and still fall if traders are already fully positioned for good news and start taking profits.
Sentiment is often described in two ways:
- Bullish or bearish on a specific currency: the share of traders betting it will rise or fall.
- Risk-on or risk-off for the whole market: whether investors are reaching for return or running for safety. Our risk-on / risk-off guide covers this side in detail.
Three Ways to Measure Forex Sentiment
| Source | What it shows | How often | How traders use it |
|---|---|---|---|
| COT report (CFTC) | Positions of large speculators, asset managers and dealers in currency futures | Weekly (Tuesday data, released Friday) | Spot crowded positions and shifts in the big money’s view. See our COT report guide. |
| Retail client positioning | The share of a broker’s clients who are long or short a pair | Live or daily, where a broker publishes it | Often read as a contrarian signal: if most retail clients are long, some traders look for shorts. |
| Risk mood | Stock indices, the VIX volatility index, US Treasury yields, AUD/JPY, gold | Live | Decide whether the day favors risk currencies (AUD, NZD) or safe havens (JPY, CHF, USD). |
| News and central bank tone | Whether data beats or misses forecasts; hawkish or dovish central bank comments | Event-driven | Gauge how surprised the market is, for example after the NFP report. |
Does Extreme Positioning Predict Reversals? Our COT Test
A common rule says that when speculators are extremely long or short, the move is “crowded” and due to reverse. We tested it. For the euro, yen, pound and Australian dollar, we took the weekly net position of leveraged funds (hedge funds and CTAs) from the CFTC’s Traders in Financial Futures report, from November 2015 to August 2026. Each week we ranked that position within its previous three years (a “COT index” from 0 to 100) and called the top 10% “crowded long” and the bottom 10% “crowded short”. Then we measured the currency’s move against the dollar over the next 12 weeks, starting after the Friday release so the test doesn’t use information traders didn’t have.
| Currency | All weeks: up after 12 weeks | After crowded long | After crowded short |
|---|---|---|---|
| Euro (EUR) | 48% (avg +0.2%) | 55% (avg +0.9%), 53 weeks | 37% (avg +0.1%), 27 weeks |
| Japanese yen (JPY) | 42% (avg −0.5%) | 51% (avg −0.4%), 55 weeks | 36% (avg −0.8%), 33 weeks |
| British pound (GBP) | 51% (avg −0.15%) | 52% (avg −0.6%), 25 weeks | 35% (avg −2.6%), 20 weeks |
| Australian dollar (AUD) | 47% (avg 0.0%) | 40% (avg −1.0%), 40 weeks | 34% (avg −1.6%), 29 weeks |
What the data says:
- Crowded shorts were not a buy signal. In all four currencies, the currency rose less often after speculators were extremely short (34-37% of the time) than in a normal week (42-51%). The speculators were usually right, at least for the next three months.
- Crowded longs gave mixed results. The euro kept rising, the Australian dollar and the pound tended to fall back, and the yen was close to normal.
- Treat the numbers with care. Each sample is small (20 to 55 weeks), and neighboring weeks overlap, so this is evidence against a simple rule, not a strategy to trade.
The lesson: an extreme reading tells you a trade is popular, not that it is over. Positioning matters most when price itself starts to turn against the crowd, because that is when crowded traders are forced to exit.
How to Use Sentiment Analysis in Trading
- Start with the trend and the fundamentals. Sentiment should refine a view, not create one from nothing.
- Check the risk mood before the session. Look at stock futures, the VIX and AUD/JPY. On a risk-off morning, buying AUD/JPY against the tide needs a very good reason.
- Look for crowding. If positioning is extreme in the direction of your trade, size smaller and expect sharper pullbacks.
- Wait for price to confirm a reversal. A crowded position is only a warning. A break in market structure, such as a lower high after a long uptrend, is the signal that the crowd is starting to exit.
- Manage risk as usual. Sentiment shifts can be fast and violent. Keep stops in place and follow your risk management rules.
Retail Sentiment: Why Some Traders Fade the Crowd
Some brokers publish the share of their clients who are long or short each pair. Because most retail accounts lose money (see our look at real broker profitability data), some traders treat a lopsided retail crowd as a contrarian sign. Retail traders also tend to buy into falling markets and sell into rising ones, which can make their positioning lean against the trend. Like COT extremes, this works best as context, not as a stand-alone entry signal.
Common Sentiment Mistakes
- Fading every extreme reading, when crowded trades can keep running for months.
- Reading old data: the COT report is already three days old when it is released.
- Ignoring which side of a currency future you are looking at. A long yen position in futures is a bet that USD/JPY falls.
- Letting a headline override a written trading plan.
Frequently Asked Questions
What is market sentiment in forex?
It is the overall mood of traders toward a currency or toward risk: whether most of them are bullish or bearish, and whether they are seeking risk or safety.
Is sentiment analysis reliable?
Not on its own. In our ten-year COT test, extreme positioning did not reliably predict reversals. Sentiment is most useful as a filter alongside price action and fundamentals.
What is a sentiment indicator?
Any measure of trader mood or positioning, such as the COT report, a broker’s long/short client ratio, the VIX volatility index or the AUD/JPY risk barometer.
Where can I find forex sentiment data?
The CFTC publishes the COT report free every Friday. Risk-mood data (stock indices, VIX, yields) is on any charting platform, and some brokers publish their clients’ long/short positioning.
What is the difference between sentiment and fundamental analysis?
Fundamental analysis asks what a currency should be worth based on the economy and interest rates. Sentiment analysis asks how traders are already positioned and how they feel, which affects how prices react to the news.
Disclaimer: This article is for educational purposes only and is not financial advice. Forex trading carries a high level of risk and may not be suitable for all investors. The CFTC notes that most retail forex customers lose money. Only trade with money you can afford to lose. The COT test describes past data and is not a trading strategy.
Sources
- CFTC, Commitments of Traders reports, and the CFTC Public Reporting Environment (Traders in Financial Futures data).
- CFTC, Customer Advisory: Eight Things You Should Know Before Trading Forex (PDF).
- Price data: Yahoo Finance daily closes for EUR/USD, USD/JPY, GBP/USD and AUD/USD, analysed by Be4TradingForex.
Keep learning