Forex Volume Explained: Tick Volume and the Best Volume Indicators
Volume is one of the most useful pieces of information in the stock market: it shows how much conviction is behind a move. In forex it is more complicated, because there is no central exchange and nobody publishes the total amount of currency traded. Yet MetaTrader shows a volume indicator on every chart. This guide explains what volume really means in forex, what the MT4 volume figures actually measure, and how to use volume indicators such as Volumes, On Balance Volume and the Money Flow Index in your trading.
What Is Volume in Forex?
In an exchange-traded market, volume is the number of shares or contracts that changed hands. The spot forex market is decentralised (over the counter): trades happen between banks, brokers, funds and other participants around the world, and no single venue records them all. That means true total volume for a currency pair is not available to retail traders.
Two substitutes are used instead:
- Tick volume: the number of price changes (ticks) during a candle, as recorded by your broker’s price feed. This is what MetaTrader’s “Volumes” indicator shows.
- Currency futures volume: currency futures, such as the euro futures traded on the CME, are exchange-traded, so their real volume is published. Some traders check it to confirm what they see on spot charts.
Tick Volume vs Real Volume
Tick volume counts how often the price changed, not how much money traded. It works as a proxy because busy markets produce more price changes: when large orders hit the market, quotes update more often. In practice, tick volume rises and falls at the same times as real activity, for example at the London open and around major news releases.
Keep three limits in mind:
- Tick volume differs between brokers, because each broker has its own price feed. Compare volume only on the same chart and broker.
- Use it to compare relative activity (this candle versus recent candles), not as an absolute number.
- Volume is naturally higher in some hours than others, so a “high volume” candle in the Asian session may still be quieter than an average London candle.
When Is Forex Volume Highest?
Activity follows the trading sessions. Volume is usually lowest late in the New York afternoon and during the Asian session for European and American pairs, rises sharply at the London open, and peaks during the London–New York overlap (roughly 13:00–17:00 GMT). Major economic releases, such as US employment data or central bank decisions, create the biggest volume spikes of all; see our guide to how economic data moves currencies.
This matters for strategy: breakouts during high-volume hours are more likely to follow through, while breakouts during quiet hours are more often false.
The Best Volume Indicators for MT4
| Indicator | What it shows | Where to find it in MT4 |
|---|---|---|
| Volumes | Tick volume per candle, coloured by whether volume rose or fell | Insert → Indicators → Volumes → Volumes |
| On Balance Volume (OBV) | Running total that adds volume on up candles and subtracts it on down candles | Insert → Indicators → Volumes → On Balance Volume |
| Money Flow Index (MFI) | A volume-weighted RSI from 0 to 100 | Insert → Indicators → Volumes → Money Flow Index |
| Accumulation/Distribution | Volume weighted by where the close falls within the candle’s range | Insert → Indicators → Volumes → Accumulation/Distribution |
| Market Facilitation Index | Bill Williams’ measure of price movement per unit of volume | Insert → Indicators → Bill Williams → Market Facilitation Index |
Volumes
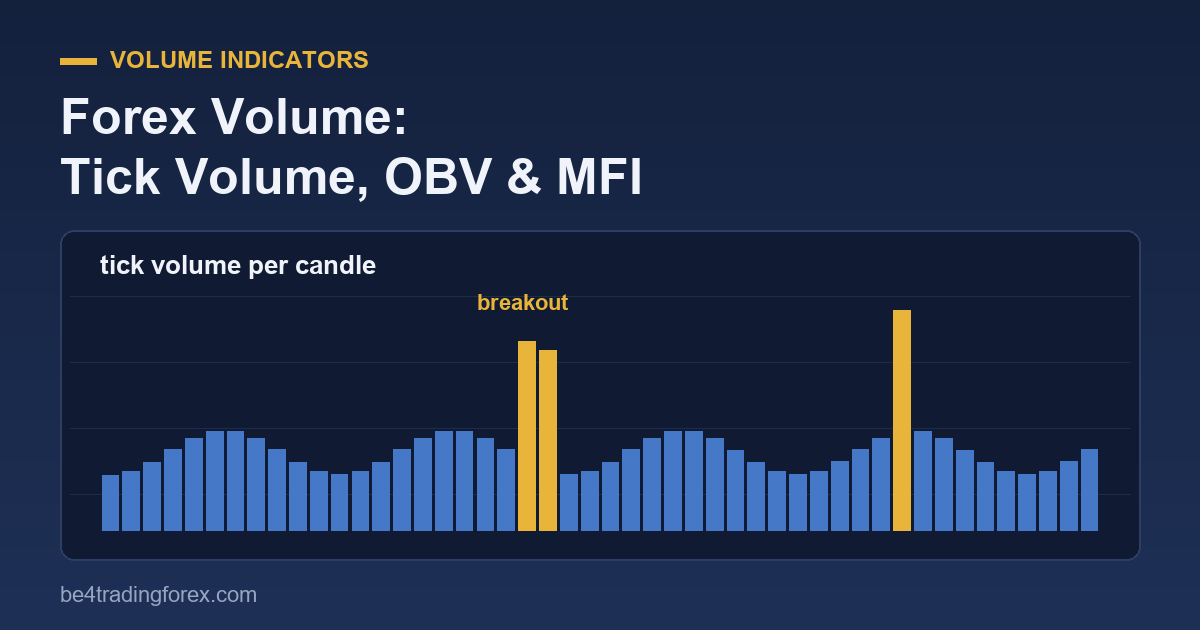
The basic histogram. Look for candles whose volume is clearly above the average of the last 20 candles. A large candle with high volume shows real participation; a large candle with low volume is more suspicious.
On Balance Volume (OBV)
Popularised by Joe Granville in the 1960s, OBV turns volume into a single line. If OBV makes higher highs while price makes higher highs, the trend is supported. If price makes a new high but OBV does not, buying pressure may be fading: a divergence worth watching.
Money Flow Index (MFI)
The MFI combines price and volume into an oscillator that moves between 0 and 100. Readings above 80 suggest overbought conditions and below 20 oversold, similar to the RSI but weighted by volume. Divergences between MFI and price are its most useful signal.
Three Ways to Trade with Forex Volume
1. Confirm breakouts
- Mark a clear range or support/resistance level.
- When price closes beyond the level, compare that candle’s tick volume with the last 20 candles.
- Take the breakout only if volume is clearly above average, and preferably during the London or New York session.
- Place the stop back inside the range and size the trade so the stop risks 1–2% of your account (see our ATR position-sizing guide).
2. Spot weakening trends with divergence
When price makes a new high but OBV or the MFI makes a lower high, fewer participants are supporting the move. Divergence is not an entry signal on its own, but it is a good reason to tighten a trailing stop or take partial profit. Read how to set a trailing stop in MT4.
3. Watch for volume climaxes
After a long trend, an unusually large candle on the highest volume for weeks can mark exhaustion: the last buyers (or sellers) rushing in. Wait for price to confirm the reversal, for example with a break of the most recent swing low, before acting on it.
Common Mistakes with Forex Volume
- Treating tick volume as exact market volume.
- Comparing volume across different brokers or different sessions without context.
- Trading every volume spike: news releases create spikes in both directions within minutes.
- Ignoring the trend: volume confirms price, it does not replace it. Combine it with trend tools such as moving averages, the Alligator or Bollinger Bands.
Forex Volume FAQ
Is volume in MT4 real volume?
No. In spot forex, MetaTrader shows tick volume: the number of price changes per candle from your broker’s feed. It is a proxy for activity, not the amount of currency traded.
Does volume matter in forex?
Yes, as a measure of relative activity. Moves on rising tick volume, especially during the main sessions, tend to be more reliable than moves on falling volume.
What is the best volume indicator for forex?
Start with the built-in Volumes histogram for breakouts and On Balance Volume for divergences. Add the Money Flow Index if you already use oscillators like the RSI.
Where can I see real forex volume?
Exchange-traded currency futures, such as those on the CME, publish real volume. Many charting platforms show futures volume alongside spot prices.
Prefer video? Watch our forex volume indicator lesson.
Keep learning