Ichimoku Kinko Hyo: The Complete Forex Guide to the Cloud
The Ichimoku Kinko Hyo looks intimidating the first time you add it to a chart: five lines and a shaded cloud on top of the candles. But it was designed to answer three practical questions at a single glance: which way is the trend, how strong is it, and where are support and resistance? This guide explains each of the five components, how to read the cloud, the default settings and three Ichimoku strategies you can test in MetaTrader 4.
What Is the Ichimoku Kinko Hyo?
Ichimoku Kinko Hyo translates roughly as “one-glance equilibrium chart”. It was developed by Japanese journalist Goichi Hosoda, who worked on it for decades before publishing it in the late 1960s. Unlike most indicators, which measure a single thing, Ichimoku combines trend direction, momentum and support/resistance into one system, and it projects part of that information into the future, which is what creates the cloud.
To add it in MT4: Insert → Indicators → Trend → Ichimoku Kinko Hyo.
The Five Components
| Line | Calculation (default settings) | What it tells you |
|---|---|---|
| Tenkan-sen (conversion line) | (9-period high + 9-period low) ÷ 2 | Short-term trend and momentum |
| Kijun-sen (base line) | (26-period high + 26-period low) ÷ 2 | Medium-term trend; a key support/resistance and stop level |
| Senkou Span A (leading span A) | (Tenkan-sen + Kijun-sen) ÷ 2, plotted 26 periods ahead | One edge of the cloud |
| Senkou Span B (leading span B) | (52-period high + 52-period low) ÷ 2, plotted 26 periods ahead | The other edge of the cloud; the slower, stronger boundary |
| Chikou Span (lagging span) | Today’s close, plotted 26 periods back | Confirms the trend by comparing price with where it was 26 periods ago |
Notice that most lines use the midpoint of the high and low, not an average of closing prices. That makes Ichimoku react to the range of price action, and it is why its lines often go flat: a flat Kijun-sen simply means the 26-period high and low have not changed.
How to Read the Cloud (Kumo)
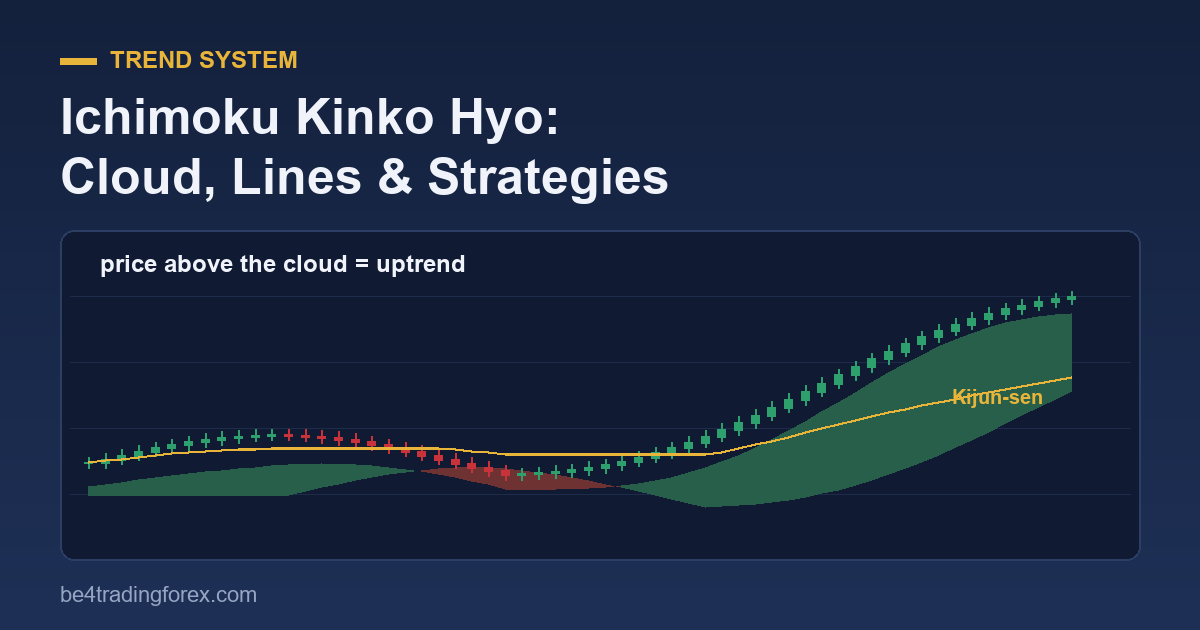
The space between Senkou Span A and Senkou Span B is shaded and called the Kumo, or cloud. It is the heart of the system:
- Price above the cloud: uptrend. The cloud acts as support.
- Price below the cloud: downtrend. The cloud acts as resistance.
- Price inside the cloud: no clear trend. Ichimoku traders usually stay out.
- Cloud colour: when Span A is above Span B the cloud is bullish (often drawn in a lighter colour in MT4); when Span A is below Span B it is bearish.
- Cloud thickness: a thick cloud is strong support or resistance; a thin cloud is easier for price to break through.
- A future “twist”: because the cloud is drawn 26 periods ahead, a coming crossover of Span A and Span B (a Kumo twist) can warn of a possible change in trend before it shows up in price.
Ichimoku Settings
The defaults are 9, 26, 52. They date from a time when markets traded six days a week (9 periods was about a week and a half, 26 about a month). Some traders adjust them for 24-hour markets, for example to 10, 30, 60, but the defaults remain the most widely used, and widely watched levels tend to matter more. Change the settings only if you have forward-tested the alternative on a demo account.
Ichimoku works on every timeframe, but it is most reliable on H4 and daily charts, where its lines filter out intraday noise. On M5 or M15 the cloud is flipped by every small swing.
Strategy 1: Tenkan/Kijun Cross with the Cloud Filter
The classic Ichimoku signal is a cross of the conversion line over the base line, graded by where it happens relative to the cloud.
- Buy when the Tenkan-sen crosses above the Kijun-sen while price is above the cloud (a “strong” signal). A cross inside the cloud is neutral; a cross below the cloud is weak and best ignored.
- Sell on the mirror image: Tenkan-sen crosses below Kijun-sen while price is below the cloud.
- Place the stop beyond the Kijun-sen or the far edge of the cloud, whichever gives the market more room, and size the position so the stop risks 1–2% of your account (see our ATR position-sizing guide).
- Exit when price closes back through the Kijun-sen, or trail the stop along it. More trailing methods are in how to set a trailing stop in MT4.
Strategy 2: Kumo Breakout
- Wait for price to close outside the cloud after a period trading inside or on the other side of it.
- Confirm with the Chikou Span: for a bullish breakout it should be above the price candles of 26 periods ago (and above the cloud there) so it has “free space”.
- Prefer breakouts through a thin cloud and in the direction of the future cloud colour.
- Enter on the close of the breakout candle or on the first pullback to the cloud edge.
Breakouts are more reliable when activity is high, during the London and New York sessions; our forex volume guide explains why.
Strategy 3: Kijun-sen Pullback in a Trend
In a strong trend, price often pulls back to the flat Kijun-sen before continuing. With price above a bullish cloud, wait for a pullback that touches or comes close to the Kijun-sen, then buy when a candle closes back in the trend direction. The stop goes a little beyond the Kijun-sen. This entry usually gives a better price than chasing a breakout.
The Full Confirmation Checklist
Many Ichimoku traders only take trades when all five components agree. For a buy:
- Price is above the cloud.
- The cloud ahead is bullish (Span A above Span B).
- Tenkan-sen is above Kijun-sen.
- Chikou Span is above the price of 26 periods ago.
- Price is not far stretched from the Kijun-sen (otherwise wait for a pullback).
Fewer trades, but each one has the trend, momentum and support on its side.
Common Ichimoku Mistakes
- Trading inside the cloud, where the system itself says there is no trend.
- Using it on very low timeframes, where signals flip constantly.
- Ignoring the Chikou Span, the component that most often filters out false breakouts.
- Placing stops too tight: Ichimoku levels are wide by design. Reduce the position size instead of tightening the stop.
- Adding more indicators: Ichimoku is already a complete system; extra oscillators usually add confusion, not edge.
Ichimoku FAQ
What is the best timeframe for Ichimoku?
H4 and daily charts give the cleanest signals. On H1 it can work for active traders; below that, the cloud changes too often.
What are the best Ichimoku settings for forex?
The default 9, 26, 52 are the standard and the levels most traders watch. Alternatives such as 10, 30, 60 exist but should be tested on demo first.
What does it mean when price is in the cloud?
The market has no clear trend. Ichimoku traders usually wait for price to leave the cloud before trading.
Is Ichimoku good for beginners?
It takes some practice to read, but it is a complete system with clear rules, which many beginners find easier than combining several separate indicators. Start with the cloud alone: trade only in the direction of price relative to the cloud.
Prefer video? Watch our Ichimoku Kinko Hyo lessons: part 1 and part 2.
Keep learning